RepoDash
Performance metrics for Github repositories
RepoDash User Guide
Pre-requisites
RepoDash was written with and tested against python 3.7.3 on a linux PC (Raspbian 10). It hasn’t currently been tested on Windows or against any earlier versions of python. However, the codebase makes use of f-strings, a feature that was introduced in python 3.6.
The codebase makes use of the following python modules not included in the standard library:
- requests
- pandas
- numpy
- sqlalchemy
- dateutil
- matplotlib
- mplcursors
These can be installed via:
python3 -m pip install -r requirements.txt
If you would like to run the tests you will also need
- pytest
- pytest-flake8
- pytest-mypy
These can be installed via:
python3 -m pip install -r requirements-dev.txt
If you encounter an error message of the following form when you run RepoDash.py you are missing a python module that needs installing manually
ModuleNotFoundError: No module named 'requests'
To install a missing python3 module open a terminal window, type the following on the command line and follow any on-screen instructions:
python3 -mpip install MODULE_NAME
Installing and Running RepoDash in Demo Mode
To download RepoDash from Github and run it in default (demo) mode, open a terminal window and type the following commands
cd YOUR-CHOICE-OF-FOLDER
git clone https://github.com/LaurenceMolloy/RepoDash.git
cd RepoDash/src
python3 RepoDash.py
This processes the first 10 pages of the matplotlib repository issues list, 1000 issues in all, and plots metrics for the most recent 12 months of issues processed.
Running RepoDash With Command Line Arguments
By using command line arguments, you can run RepoDash against any public Github repository, request any number of pages starting from any specific page of the issues list, and output issues list metrics for any time period of your choosing. You can also choose whether to look at pull request metrics or issue metrics. The available command line options are as follows:
| -a, --authtoken | Github Personal Access Token | (default: '') |
|---|---|---|
| -fqdn | Fully qualified domain name for github server | (default: 'api.github.com') |
| -https | Use HTTPS | (default: False) |
| -u, --user | Github username or account | (default: 'matplotlib') |
| -r, --repo | Github repository name | (default: 'matplotlib') |
| -t, --type | Issue type ('issue', 'pull_request') | (default: 'issue') |
| -m, --months | plot metric analysis timespan in months | (default: 12) |
| -d, --refdate | plot metric reference end date | (default: now) |
| -f, --firstpage | first page number to request | (default: 1) |
| -c, --pagecount | number of pages of issues to request | (default: 10) |
| -o, --offsetmonth | which month to offset issue closure in ('opened', 'closed') | (default: closed) |
| -s, --savefile | save dashboard image to a file | (default: ./metrics.png) |
| -il, --inlabfile | labels/groups mapping file (CSV) | (default: ./label.csv) |
| -ol, --outlabfile | file to write labels/groups out to (CSV) | (default: ./outlabel.csv) |
| -nl, --numlabs | number of labels to plot in the top N label count display | (default: 12) |
| -p, --datapath | location of SQLite database | (default: REPODASH_PATH/data) |
| -i, --info | write environment info for debugging | writes a debug_info.txt file |
| -h, --help | print options/help text |
Notes
Database Interaction: The current version of RepoDash wipes and re-generates the database with every run. An update mode of operation is planned in the future. This will allow you to focus only on changes and additions since the previous run, reducing the number of API calls required.
Output: By default, RepoDash renders the output as an image in a window on the desktop. You can override this and save the image to a file for sharing by email or inclusion in a report by using the -s argument. When used without specifying a filename, it defaults to saving to a file called metrics.png in the current folder. There is no interactive functionality when saving the image to a file.
Grouping Issue Labels: By default, RepoDash will display the frequency of the top 12 labels used for all issues that remained open at the end date of the time period of interest. To do this, it first has to read in the full list of issue labels via the Github API. You can save this list to a CSV file using the -ol (output label file) argument. It is sometimes desirable to be able to organise the project’s issue labels into groups (for instance, grouping all labels that refer to an aspect of a project’s API). This can be done by manually editing the saved CSV file to associate multiple ‘label’ values (first column) with a common label_group value (second column) and then supplying this edited file to the program using the -il (input label file) argument.
Authentication: You can run RepoDash against any public Github repository without authentication. This limits you to 60 Github API web requests per hour. If you have a Github account you can request a Personal Access Token from HERE (selecting the Repo scope) and supply it on the command line using the -a option. This will increase your requests limit to 5000 per hour.
Out Of Range Timespans: If you specify a reference date for metrics and/or request a timespan that falls outside the date range of the issues data collected, RepoDash will do its best to adjust the dates and/or shorten the plotting timespan so that it maps as closely as possible to the data available.
Example Usage
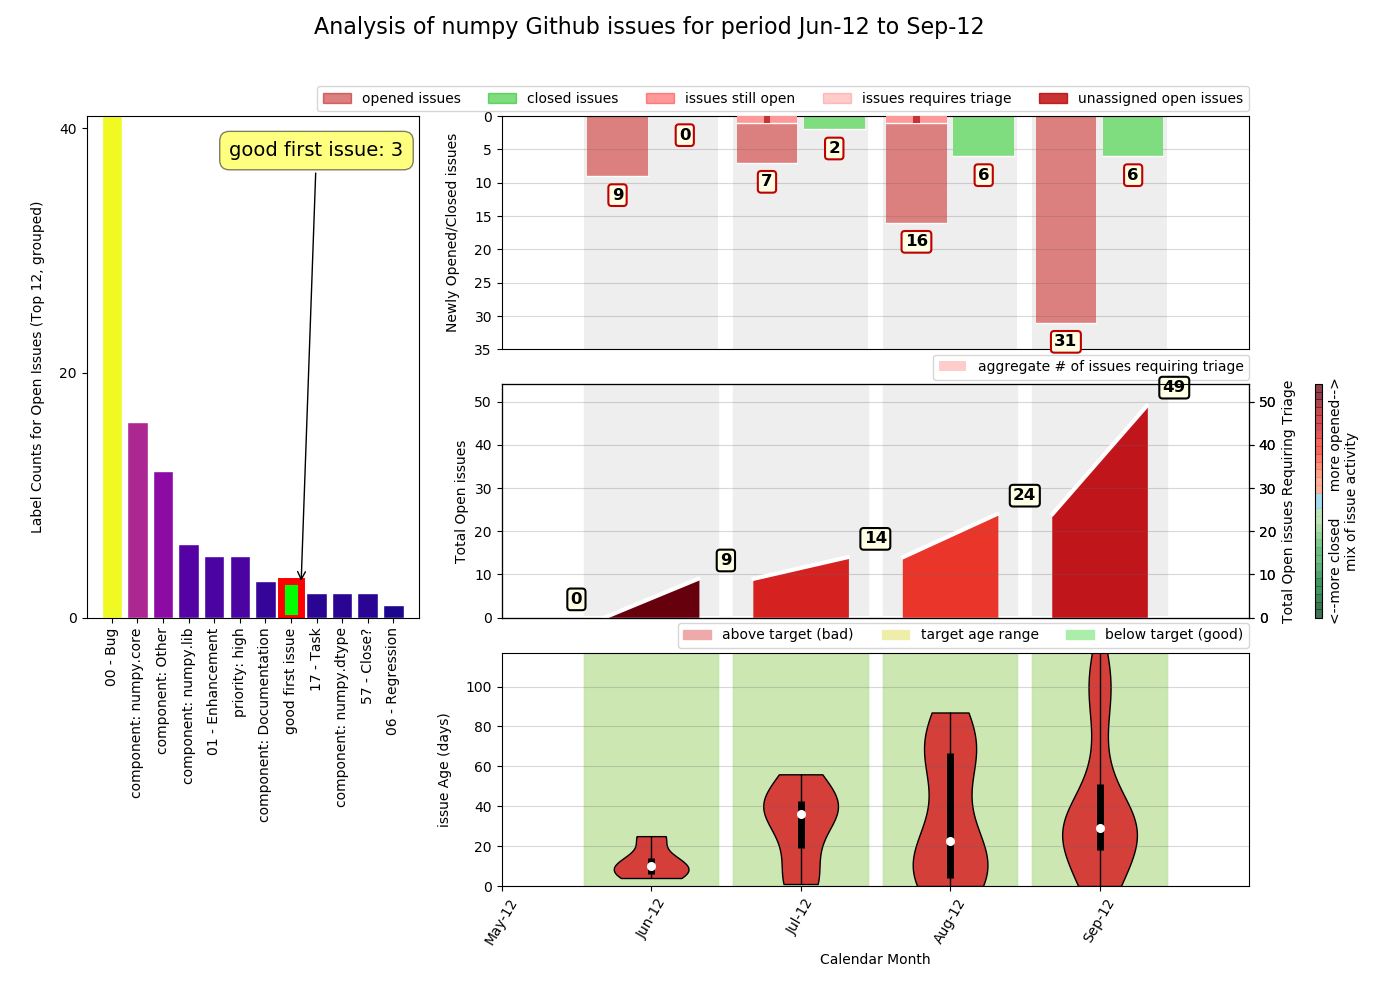
EXAMPLE 1: Numpy Issues
Process the first 6 pages of the issues list from the Numpy repository and plot issue and label metrics for the period June 2012 to September 2012 inclusive (4 months). You may notice that there are labels with a count of zero in the label count display. These are labels that were attached to issues that were both opened and closed during the period June 2012 - September 2012.
python3 RepoDash.py -u numpy -r numpy -m 4 -d '2012-09' -c 6
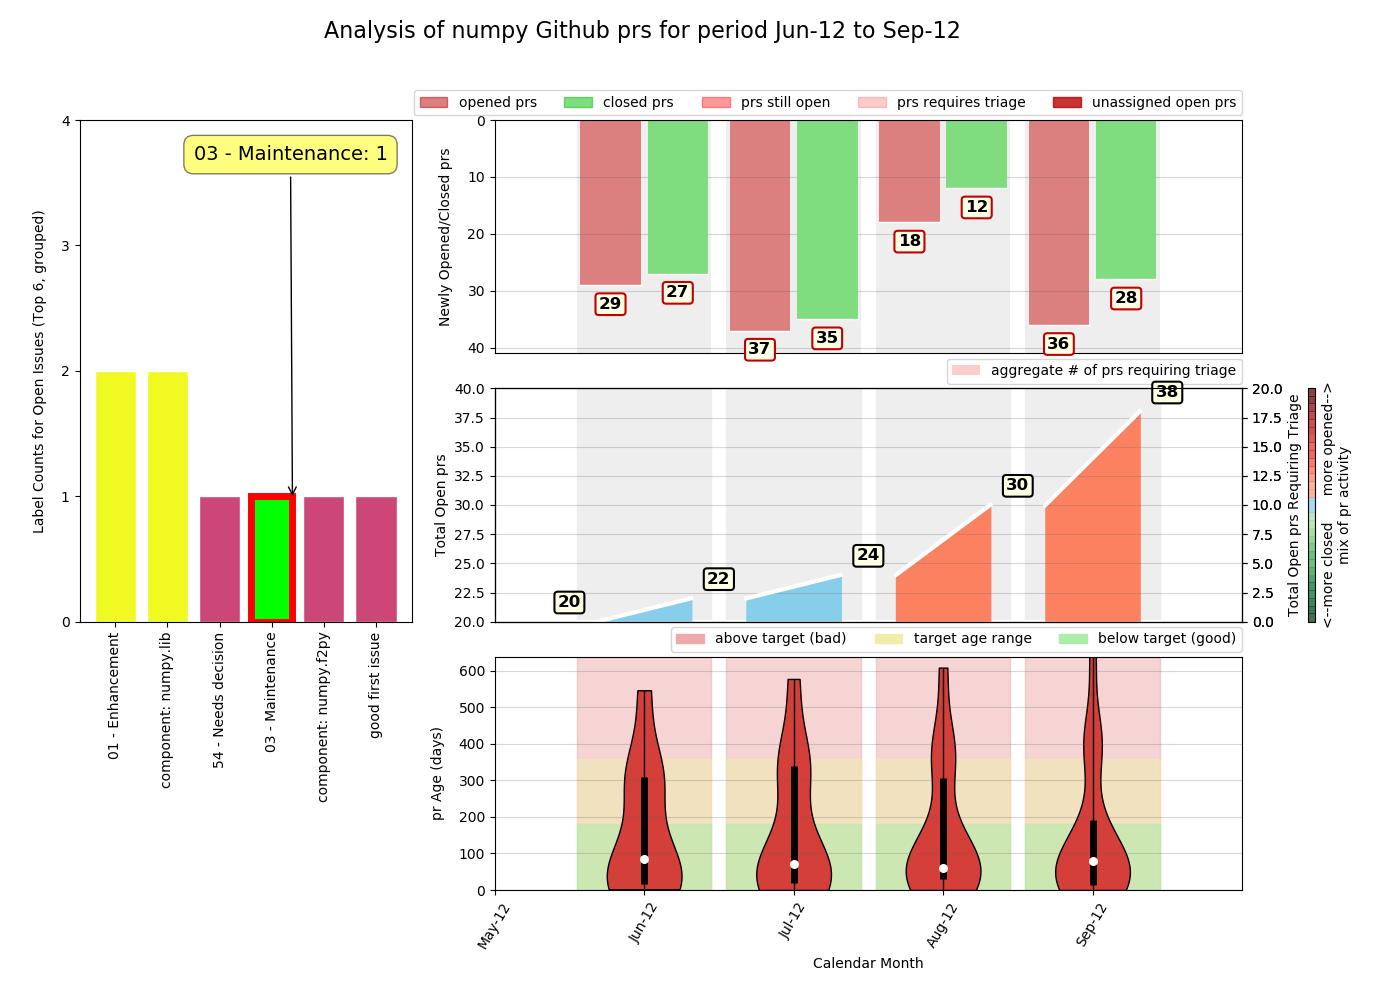
EXAMPLE 2: Numpy PRs
Process the first 6 pages of the issues list from the Numpy repository and plot pull-request and label metrics for the period June 2012 to September 2012 inclusive (4 months).
python3 RepoDash.py -u numpy -r numpy -m 4 -d '2012-09' -c 6 -t pr
EXAMPLE3: Pandas Issues (with issue closure offset in the month in which it was closed)
Process pages 200 to 249 (50 pages) of the issues list from the Pandas repository and plot the last 6 months of issue metrics and the top 20 labels used.
python3 RepoDash.py -u pandas-dev -r pandas -m 6 -f 200 -c 50 -nl 20
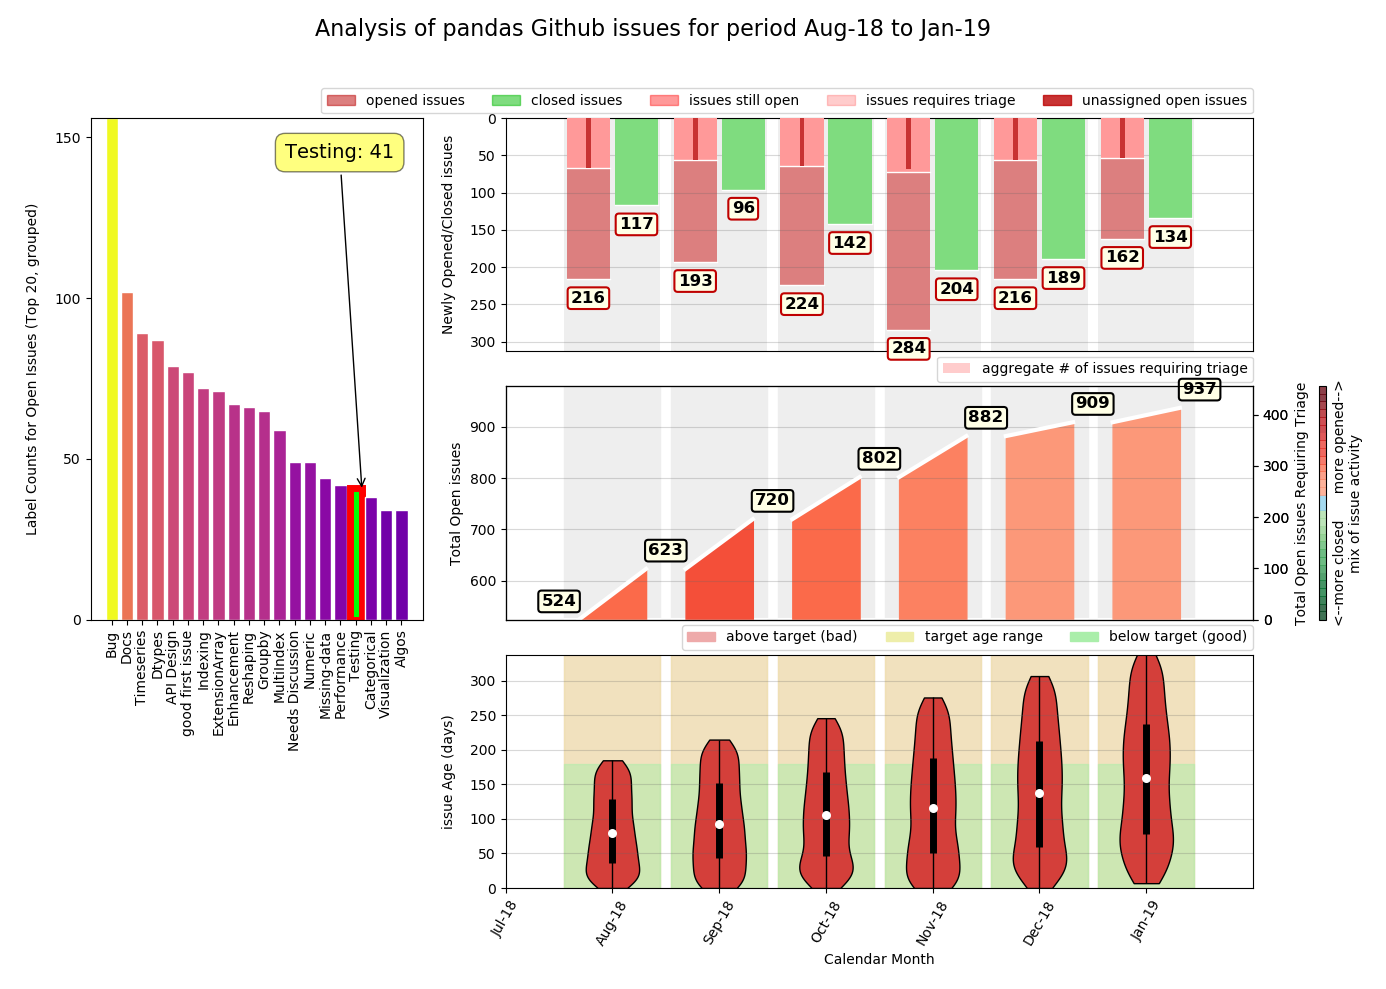
Notes
- The silent -o (offset month) option defaults to ‘closed’, which calculates Total Open Issues as a simple aggregate of issues opened - issues closed in each month.
- The silent -d (reference date) argument defaults to now. This falls outside of the date range observed in the data processed, so RepoDash maps the plotting timeframe to the last 6 calendar months of the data (6 months is our requested timespan).
- RepoDash has no knowledge of any issues that were opened or closed prior to the earliest issues processed. For simplicity, it presumes an empty issues list prior to this point. The Total Open Issues count is therefore relative to a zero count at the start of the processed data timespan (February 2018 in this example).
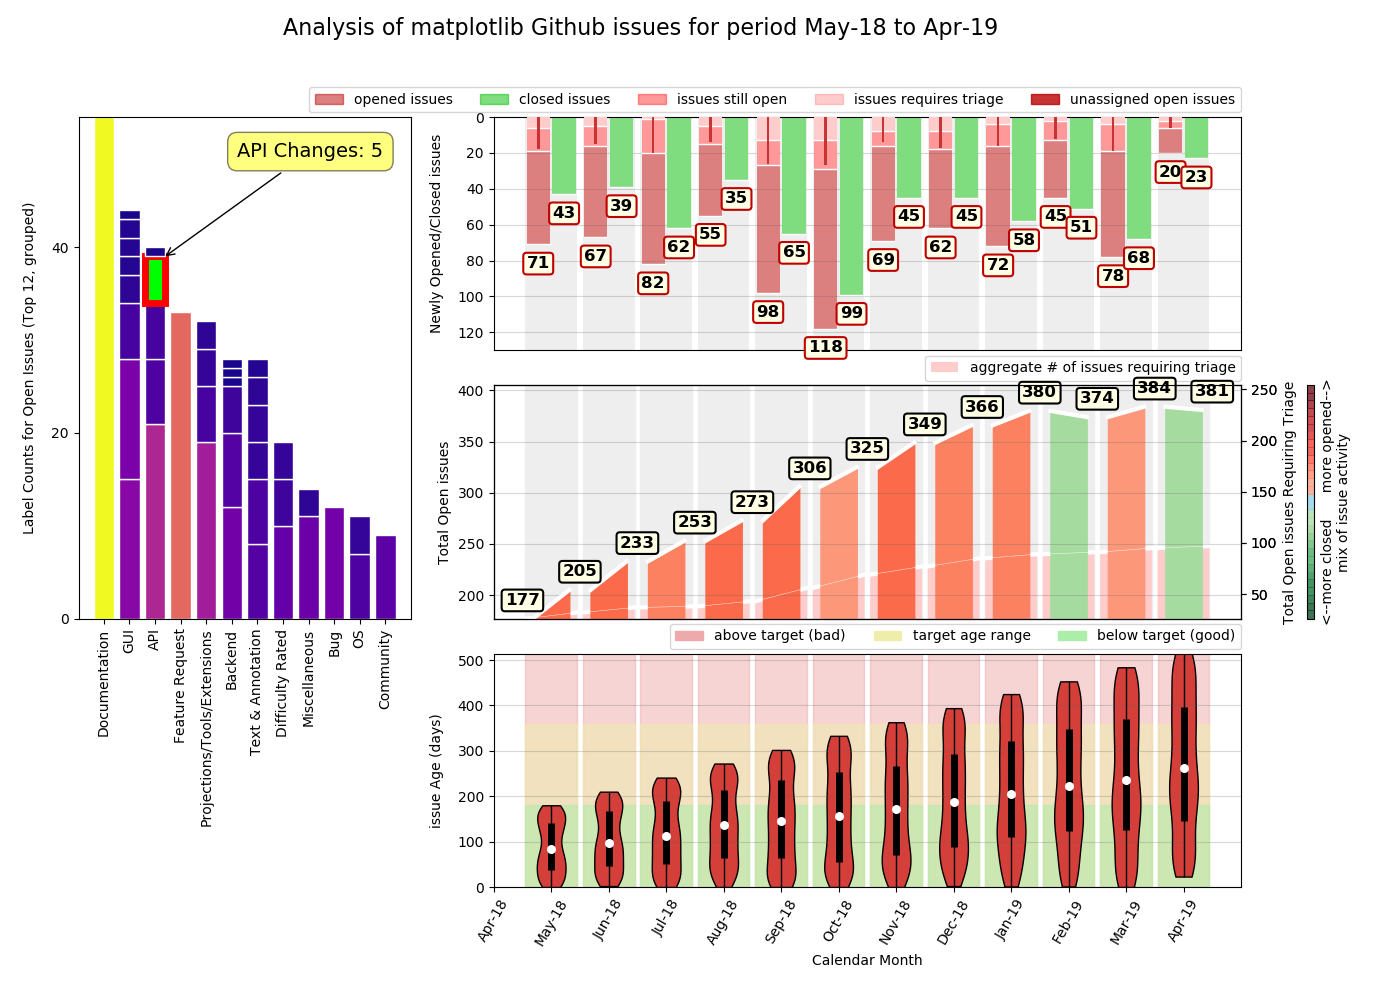
EXAMPLE4: Matplotlib Issues with grouped label counts
Process pages 100 to 139 (40 pages) of the issues list from the Matplotlib repository and plot the last 12 months of issue metrics and label counts, grouped according to a label grouping file (supplied using the -il argument).
python3 RepoDash.py -u matplotlib -r matplotlib -m 12 -f 100 -c 40 -il ../config/example_matplotlib_label_file.csv